


Lower prices of telecommunication services by operation of regulatory measures and concessionaires new packages (Press Release 17/2015)
Lower prices of telecommunication services by operation of regulatory measures and concessionaires new packages
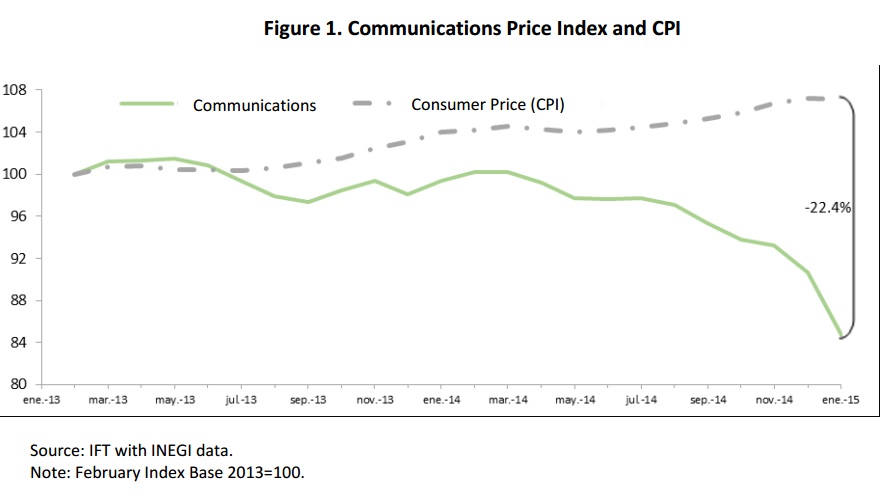
• While the National Consumer Price Index (CPI) registered a growth rate of 7.2% between February 2013 and January 2015, the communications price index fell by 15.3%
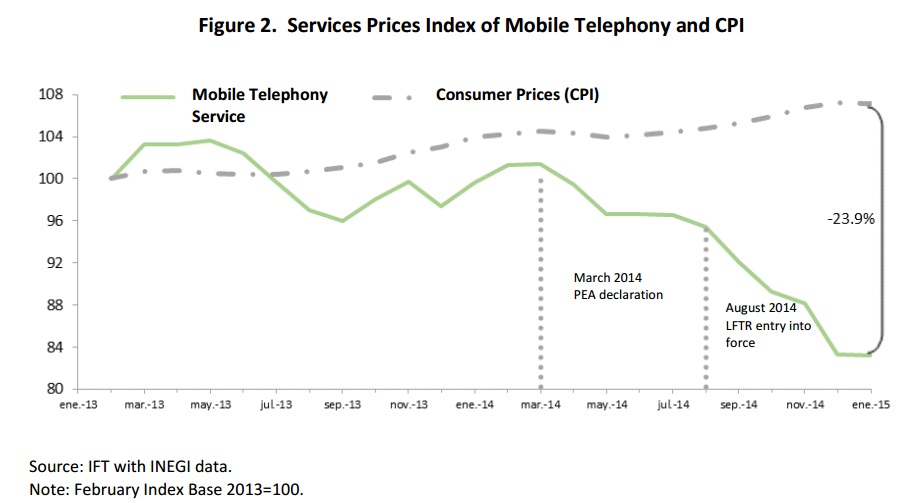
• In mobile telephony reduced prices were observed in 16.7% for that period
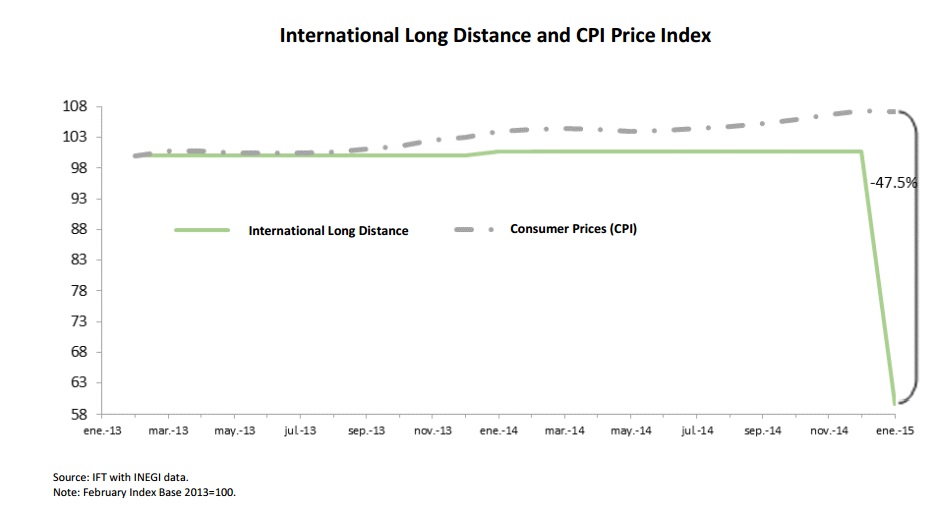
• In Long International Distance there was a decrease of 40% from January 2015, indicating an indirect impact by eliminating the charge for Long National Distance, because the operators included minutes for calls abroad in their plans
Under the behavior observed in the price indices reported by the National Institute of Statistics and Geography (Instituto Nacional de Estadística y Geografía, INEGI), the Federal Telecommunications Institute (Instituto Federal de Telecomunicaciones, IFT) conducted an analysis of the various price indices of services that integrate it, particularly those that make up the telecommunications sector.
The price index of communication has become increasingly important within the basic basket of consumer services. It currently has a weighting in the overall National Consumer Price Index (CPI) of 4%. This weighting is higher, e.g. the total of fruits and vegetables, beef, pork and chicken as a whole.
Figure 1 shows the behavior of the index during the period between February 2013 and January 2015. The growth rate of the CPI during the study period was 7.2%, while the communications price index for the same period decreased by 15.3 percent.
Price indices for telecommunications sector services
From the components of the overall price index communication behavior of prices, six services within the telecommunications sector were analyzed:
• Mobile Telephony
• Fixed Telephony
• National long distance
• International Long Distance
• Internet
• Restricted TV
In all cases a comparison of these indices compared to the CPI was carried out.
Mobile Telephony
From February 2013 to March 2014, the price index of mobile phone service has averaged 100.3 points, i.e., on average there were no significant changes during this period, since the base of the index equals 100. Later a fall in the index is observed, it is emphasized after the first quarter of 2014.
During the analyzed period the rate of change of the price index of mobile services decreased by 16.7%, which contrasts with the increase of 7.2% in the CPI (see Figure 2). Of the services analyzed, this is the one that presents more global communications price index (correlation about 97%) alike behavior.
In the case of mobile telephony during the period under review were two factors that presumably could have affected the change in the trend of the price index:
• The statement of the Preponderant Economic Agent (PEA) in March 2014, which resulted on the removal of roaming charge, unlock of equipment and imposition of charges to PEA for asymmetric interconnection since April.
The entry into force of the Federal Telecommunications and Broadcasting Law (Ley Federal de Telecomunicaciones y Radiodifusión, LFTR) in August 2014, where is established the zero rate at PEA interconnection.
National Long Distance (NLD)
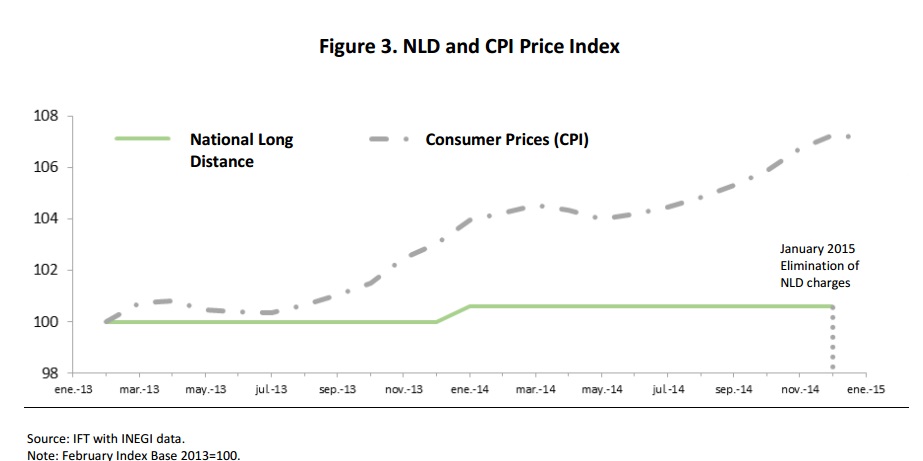
From January 2015, charges for national long distance were removed. This implied that all calls made by users in the country were considered local. The impact of this measure on the price index of NLD is that from the beginning of 2015 the index is zero (see Figure 3).
International Long Distance (ILD)
Regarding ILD price index, the elimination of charges for NLD had an indirect impact, but significant. This includes an improvement in offering fixed telephony packages offered by operators, including the PEA, in late 2014, whose purpose is to make their products more competitive. These included international minutes within their packages while the price of additional international minutes decreased. This translates into a 40% decline from January 2015.
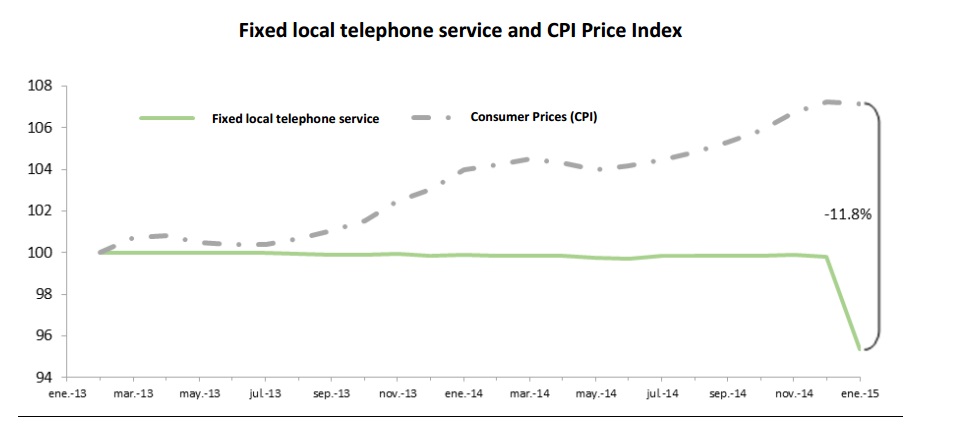
Fixed telephony
The price index of fixed local telephone service noted a decrease of 4.6% in the period analyzed, which can be also explained by the introduction of new packages of fixed telephone services at the end of 2014, as mentioned above.
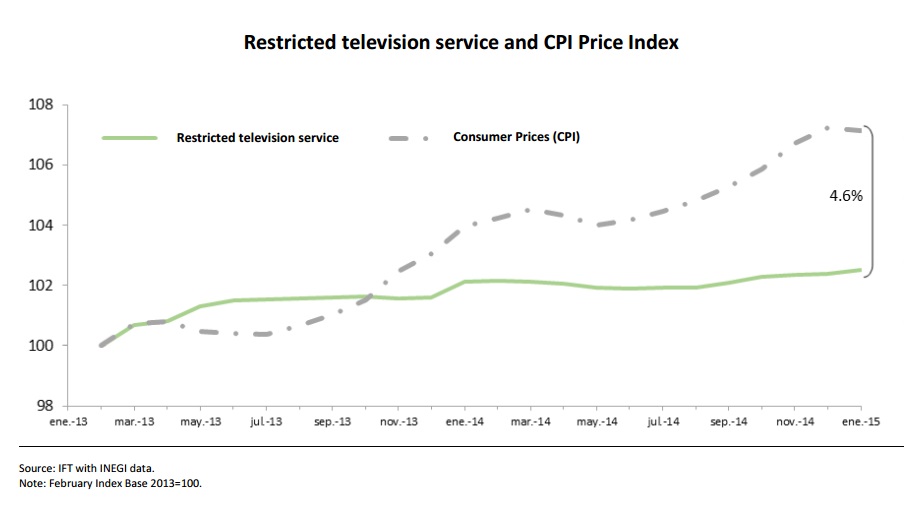
Restricted TV
The restricted television service index of prices showed a growth of only 2.5% during the study period. This growth is equivalent to just under a third of the recorded by the CPI during the same period. Note that this was the only sector of telecommunications service that recorded an increase.
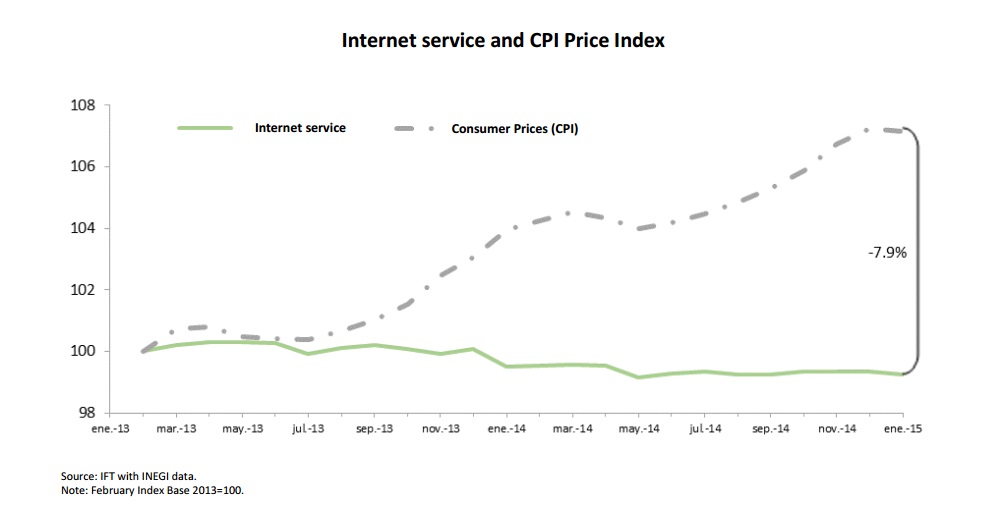
Internet
The price index of Internet service recorded a decrease during the period of 0.8%, but it is worth noting that when compared with growth of 7.2% in the CPI represent a significant decrease in real terms.
Structural change in the communications price index
A statistical exercise was conducted to the series of communications price index in order to find evidence of any structural change after the entry into force of the measures related to the declaration of preponderance on March 2014. Two periods were defined: November 2007 to March
2014 and April 2014 to January 2015.[1] Although the analysis does not prove causality between regulatory measures and the price index reduction, it does reveal statistical evidence that prices decline further in communications from regulatory measures mentioned above, which shows evidence of an structural[2] change.
Summary table
The following table presents a summary of the price indices presented. The difference with respect to CPI is calculated as the difference between the rate of change of the CPI and the exchange rate of the respective indices. It is observed that all growths, except the index of restricted television service, are negative for the CPI. This means that these indices behaved contrary to the CPI increase.
Price Index | Rate of change (%) Feb 13 - Jan 15 | Differential in respect to CPI |
Consumer Price Index (CPI) | 7.2 | NA* |
Communications Index | -15.3 | -22.4 |
Restricted television service | 2.5 | 4.6 |
Internet service | -0.8 | -7.9 |
Local fixed telephone service | -4.6 | -11.8 |
Mobile telephone service | -16.7 | -23.9 |
International long distance | -40.3 | -47.5 |
National Long Distance | -100.0 | -107.2 |
[1] These two periods were defined because from November 2007 began a downward trend in the communications price index. The average annual growth rate for the period November 2007 to March 2014 was -3.4%, while the average rate of annual growth in April 2014 to January 2015 was -18.9%.
[2] The statistical method to infer structural change Chow test was used. The results show that there is a structural change of structural change from April 2014 with a higher level of significance at 98%.
