


The Federal Telecommunications Institute announces the evolution of telecommunication services in the second quarter of 2014 (Press Release 52/2014)
The Federal Telecommunications Institute announces the evolution of telecommunication services in the second quarter of 2014
• The rates of mobile phone service and Internet decreased 9.1% and 4.6% respectively
• The base of mobile phone service reached 103.9 million subscriptions
• The international long distance traffic recorded an increase of 3% over the same quarter in 2013
• Restricted TV service reached a total of 15.4 million subscriptions, driven by growth of 0.27% in the segment of cable and 13.79% for satellite, over the same period in 2013
Currently, the Federal Telecommunications Institute (Instituto Federal de Telecomunicaciones, IFT) is in the process of redesigning systems for collecting and processing information for integrating metrics and statistics of regulated sectors, based on the powers that were granted in the Federal Telecommunications and Broadcasting Law (Ley Federal de Telecomunicaciones y Radiodifusión, LFTR) and recently entered into force. Meanwhile, the IFT will continue publishing industry statistics based on the methodology applied to date. In this context, for the second quarter 2014 the report is submitted.
Mobile Telephony
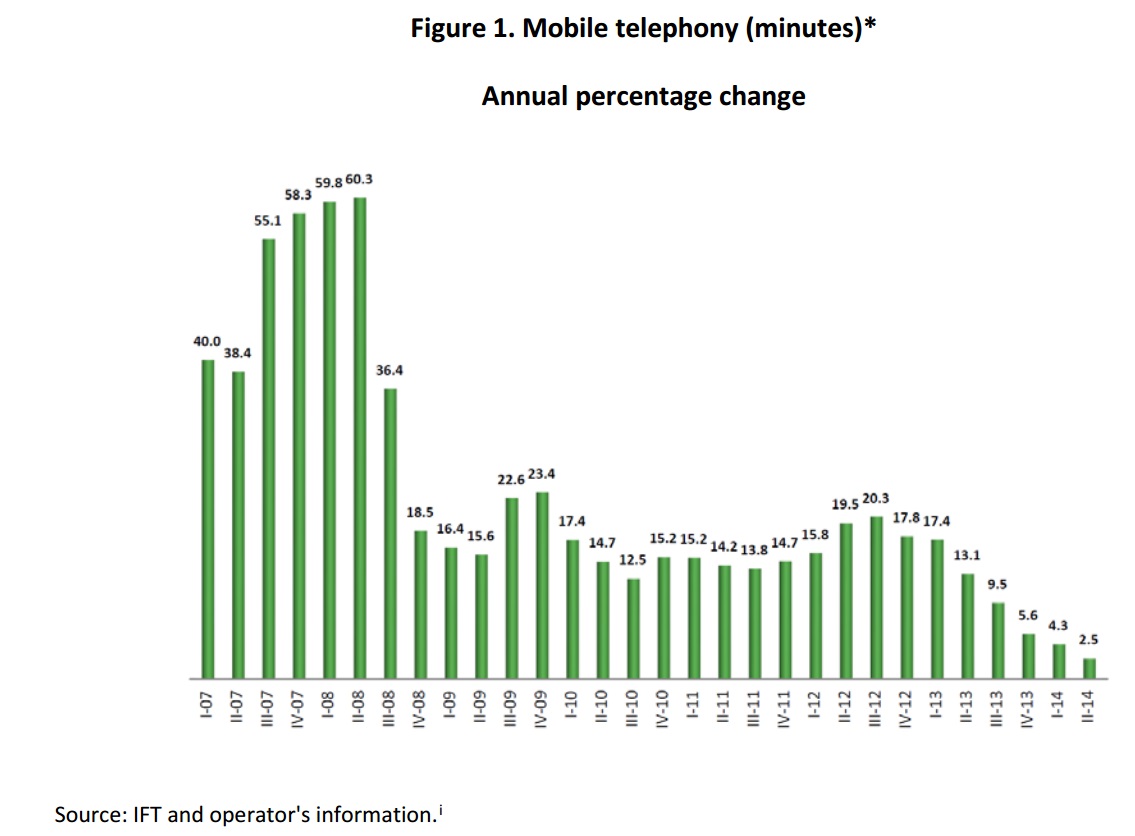
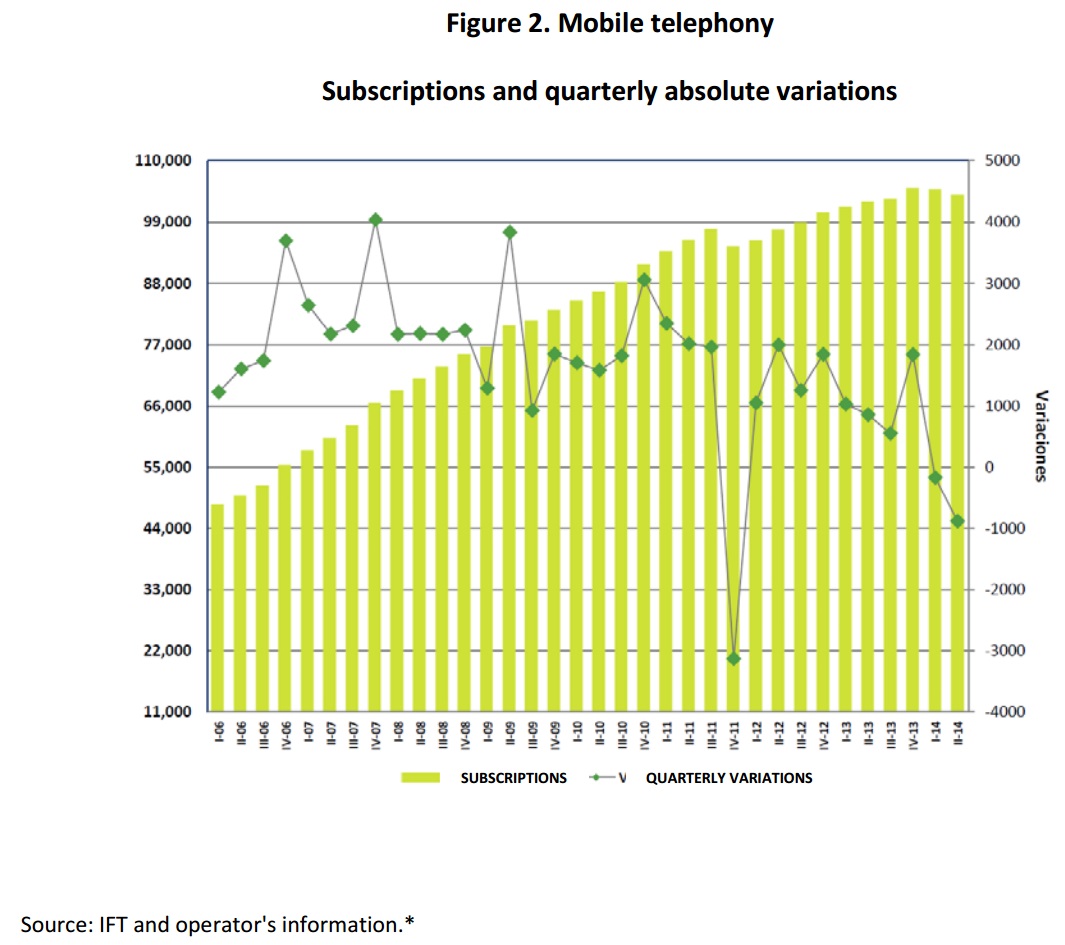
The mobile telephony service recorded an increase of 2.5% in the minutes of tracked network traffic during the second quarter of 2014 (see Figure 1). During this quarter, 1.34 million subscriptions were added, which represented a 1.3% increase over the same period last year.
In relation to the number of mobile phone subscriptions, one upward trend is observed when compared with the same period last year, from 102.6 to 103.9 million (see Figure 2). At the end of the second quarter a density of subscriptions was reached 86.8 per 100 inhabitants.
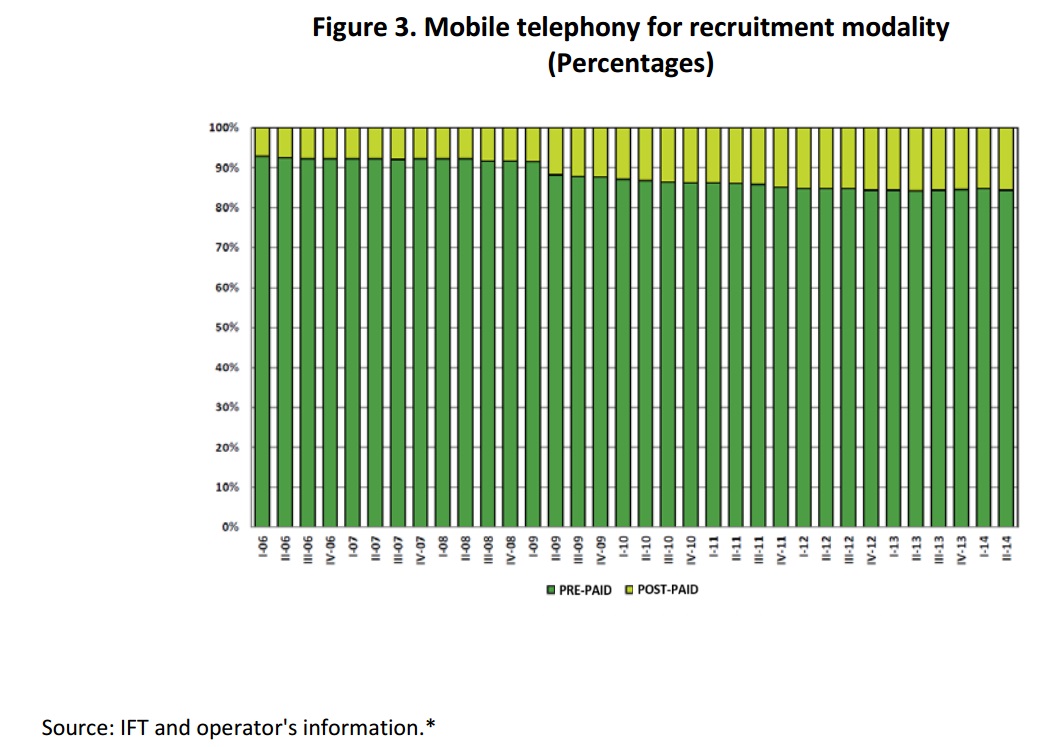
On the composition of this market by type of subscription, at the end of the second quarter of 2014, 16.3 million postpaid users were reported, representing 15.7% of total subscriptions. While in the prepay modality, the number closed at 87.6 million subscriptions, representing 84.3% of total subscriptions.
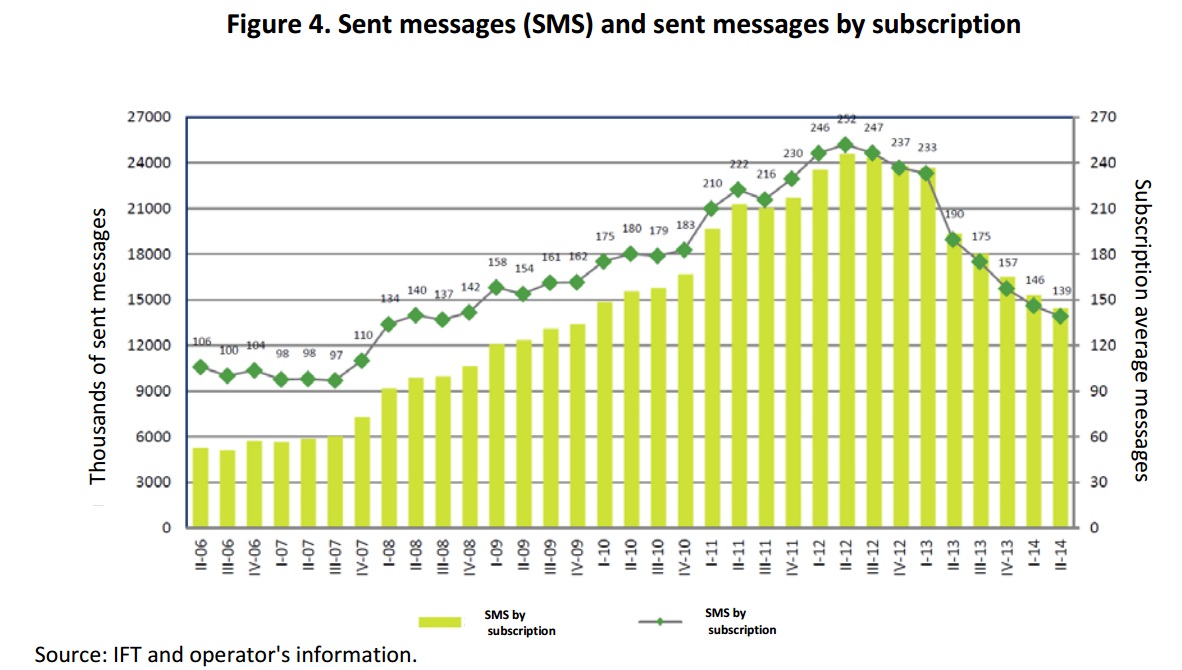
Sent messages (SMS) by mobile cellular networks, observed a decrease of 25.4% from the second quarter of 2013, equivalent to an average of 139 messages sent by subscription in the reporting period. This trend is explained largely by the use of new technologies for sending messages using data service.
Fixed voice local telephony
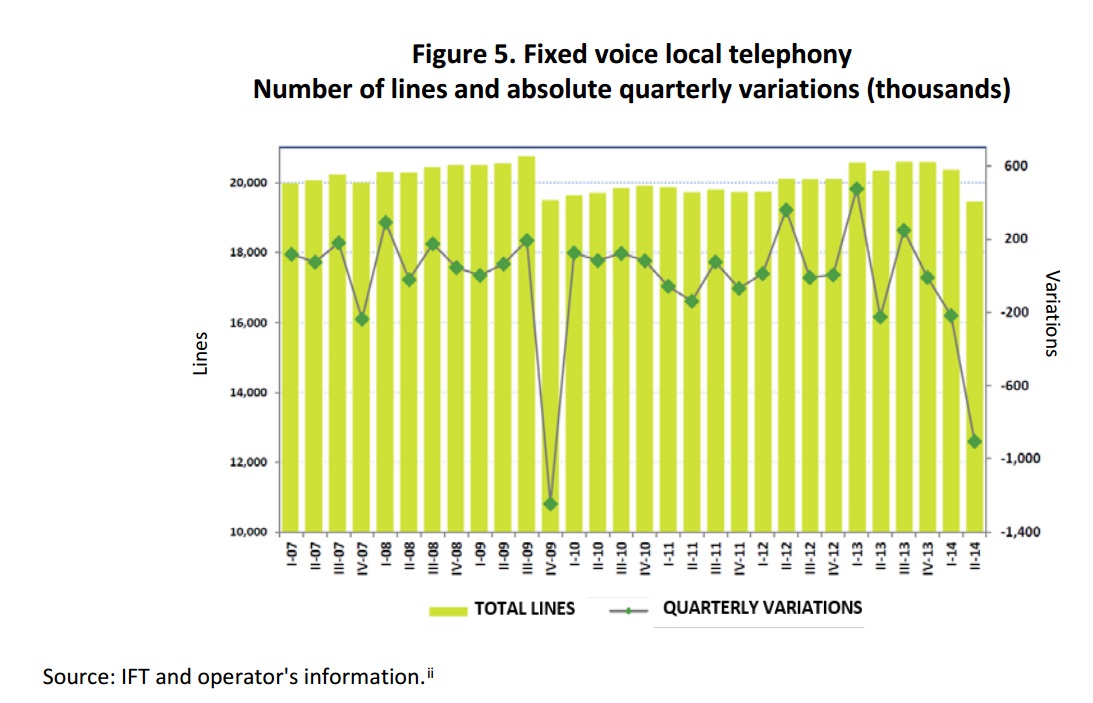
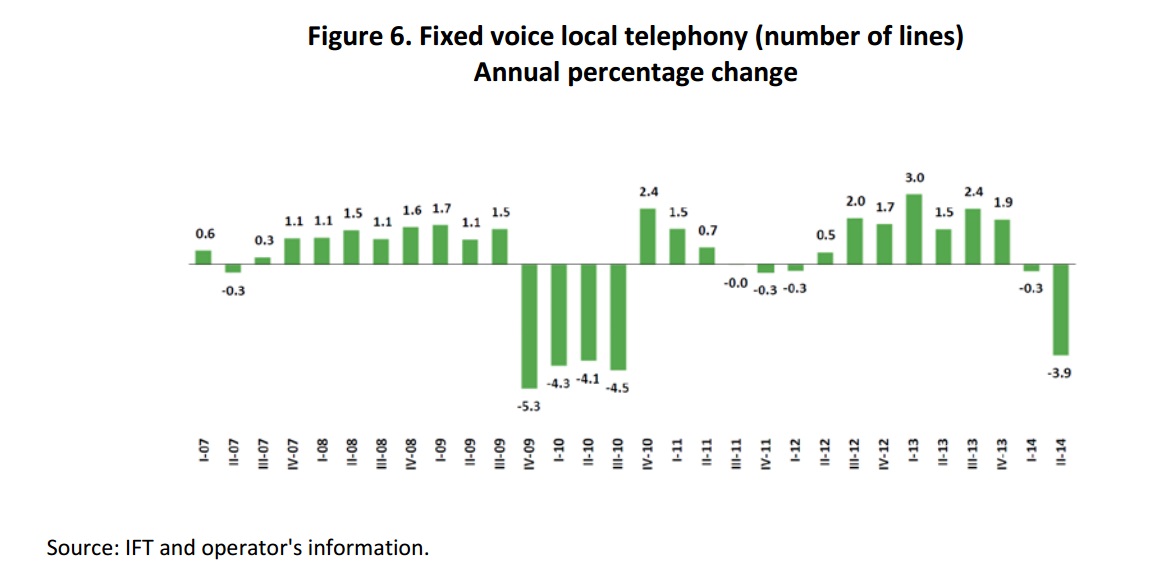
At the end of the second quarter of 2014, fixed telephone subscriptions represented a total of 19.5 million, as shown in Figure 5. From the third quarter of 2013 the number of fixed telephone lines is narrowing; for the evaluated quarter represents a decrease of 3.9% over the same period in 2013 (see Figure 6). At the end of the second quarter, a density of 16.3 fixed phone subscriptions per 100 inhabitants was reached.
National Long Distance (NLD)
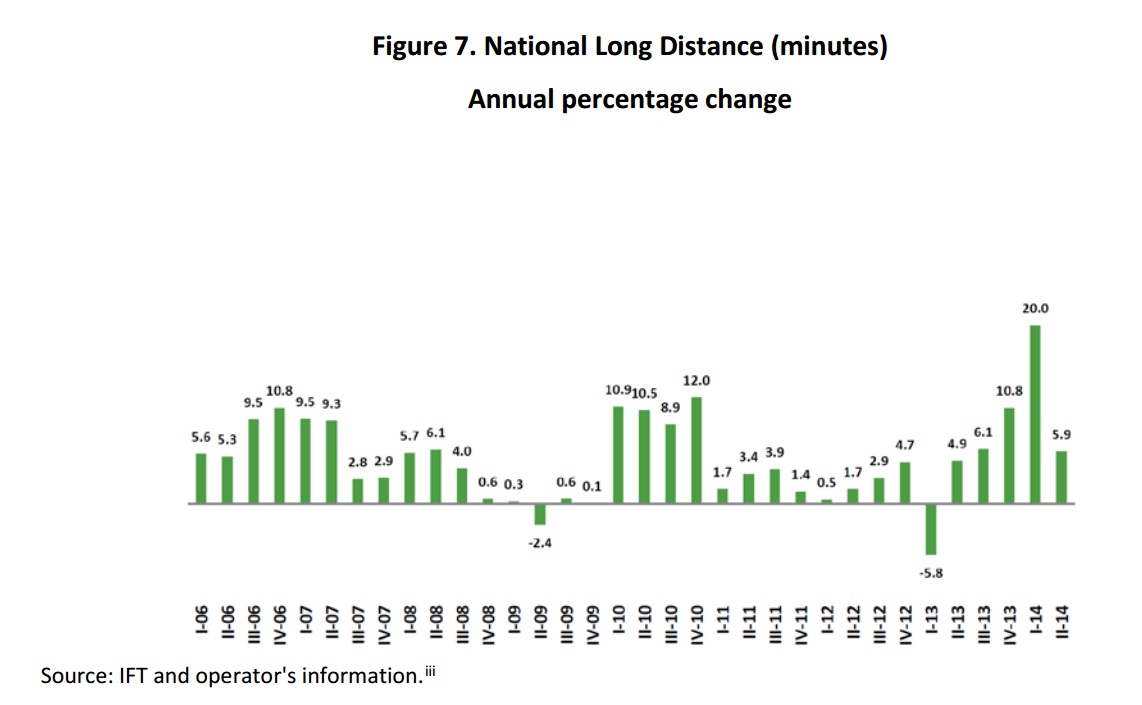
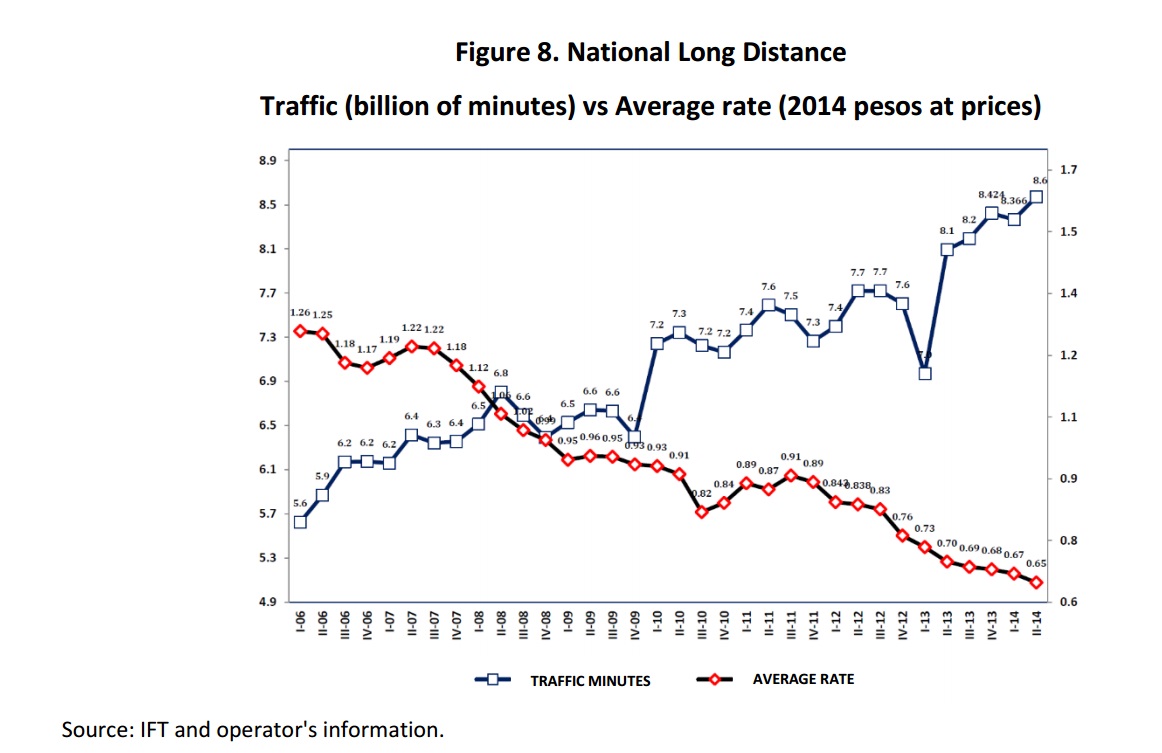
During the reported quarter, the traffic measured in minutes grew 5.9% over the same quarter in 2013 (see Figure 7). The average rate of domestic long distance telephony, recorded for the referenced quarter, it stood at 65 cents per minute, compared with 70 cents per minute of the second quarter of 2013, which continues the downward trend. With respect to national long distance, in Figure 8 an increasing trend is observed since the first quarter of 2013, generally, it could be explained by a negative correlation between traffic and the average rate (see Figure 8).
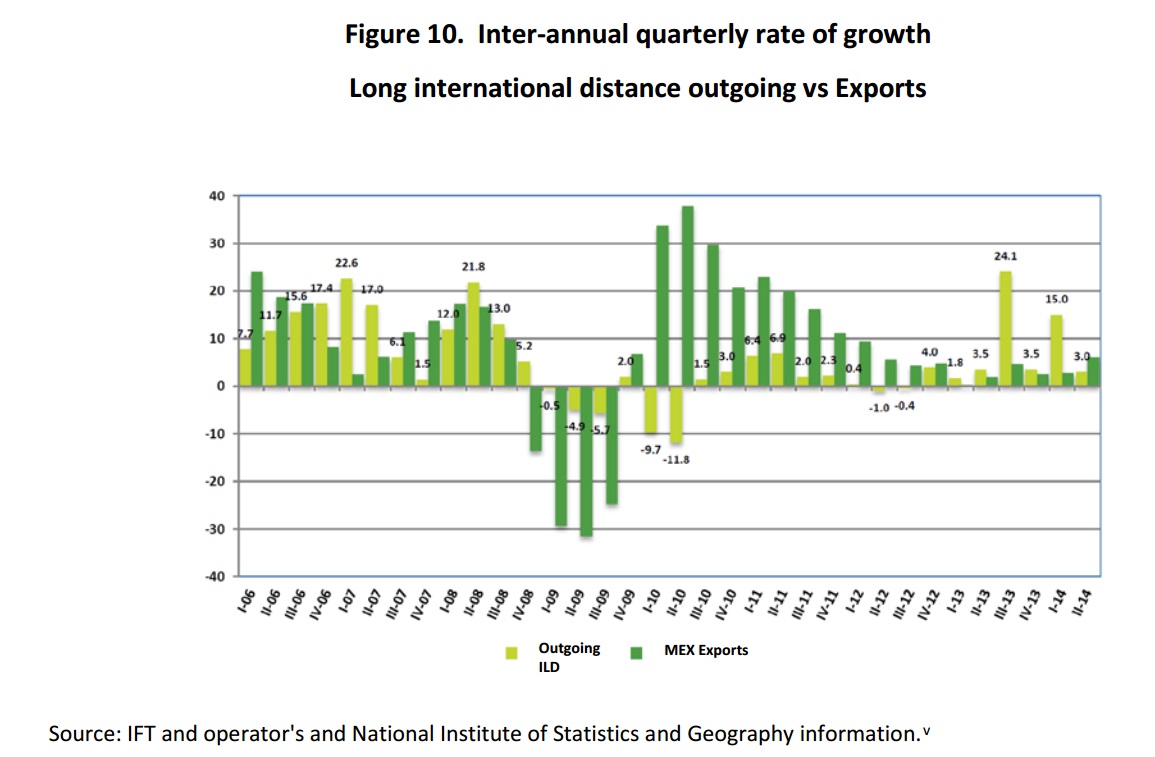
International Long Distance (ILD)
For the 2014 second quarter, minutes of international long distance input stood at 6.9 billion, representing an increase of 20.1% over the same period last year.
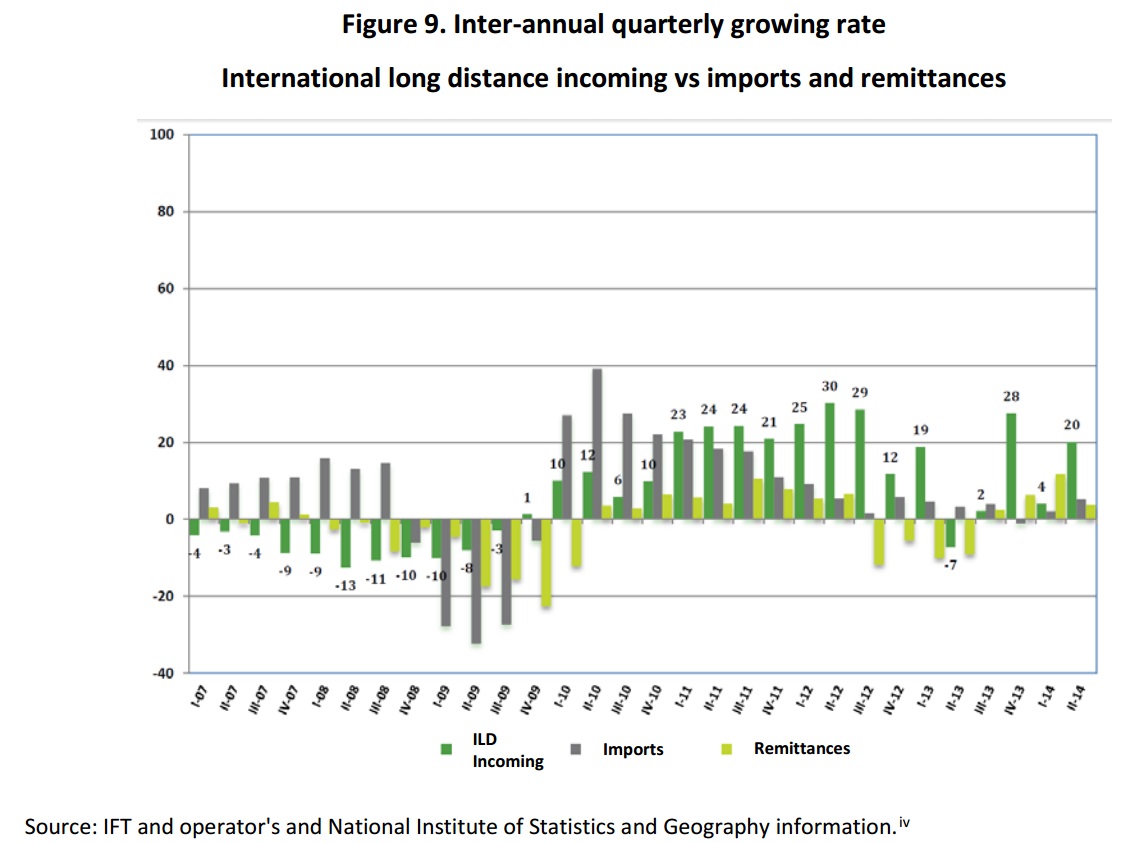
The minutes of international long distance had a lower output growth compared to the same quarter last year to end the quarter with an increase of 3% increase from the same period of 2013.
Restricted Television
The restricted television market is showing an increasing dynamism, since operators offer a wider range of tariff plans that are accessible to a greater number of people and, therefore, encompasses more sectors of the population. Subscriptions to the end of the quarter are 15.4 million. At the end of the second quarter density reached 12.9 subscriptions per 100 inhabitants. The restricted television service is offered primarily through three technologies: satellite or DTH, cable and MMDS TV or microwave. During the second quarter of 2014, the pay television service grew 6.9% over the same period in 2013.

The satellite TV service or DTH television, showed a growth of 13.79% over the same quarter of 2013. This modality for the service reached 8.3 million subscriptions at the end of the second quarter of 2014.
Restricted television noted a slowdown in growth that occurred in previous quarters, this being 0.27% as opposed to 15.53% in the same quarter of 2013. The service ended the quarter with 6.9 million subscriptions, which represent 45% of total of restricted television users.
The number of subscriptions to television services via microwave or MMDS maintains its downward trend, showing a 20% decrease compared to the same quarter of 2013. At the end of the period, this service has 122,600 subscriptions.
Trunking
During the second quarter of 2014, the number of users in the system decreased 60.1% compared to the same period in 2013, representing the largest drop since this service is measured. The number of users of this service stood at 1.3 million at the end of the second quarter of 2014, representing 1.1 subscriptions per 100 inhabitants.
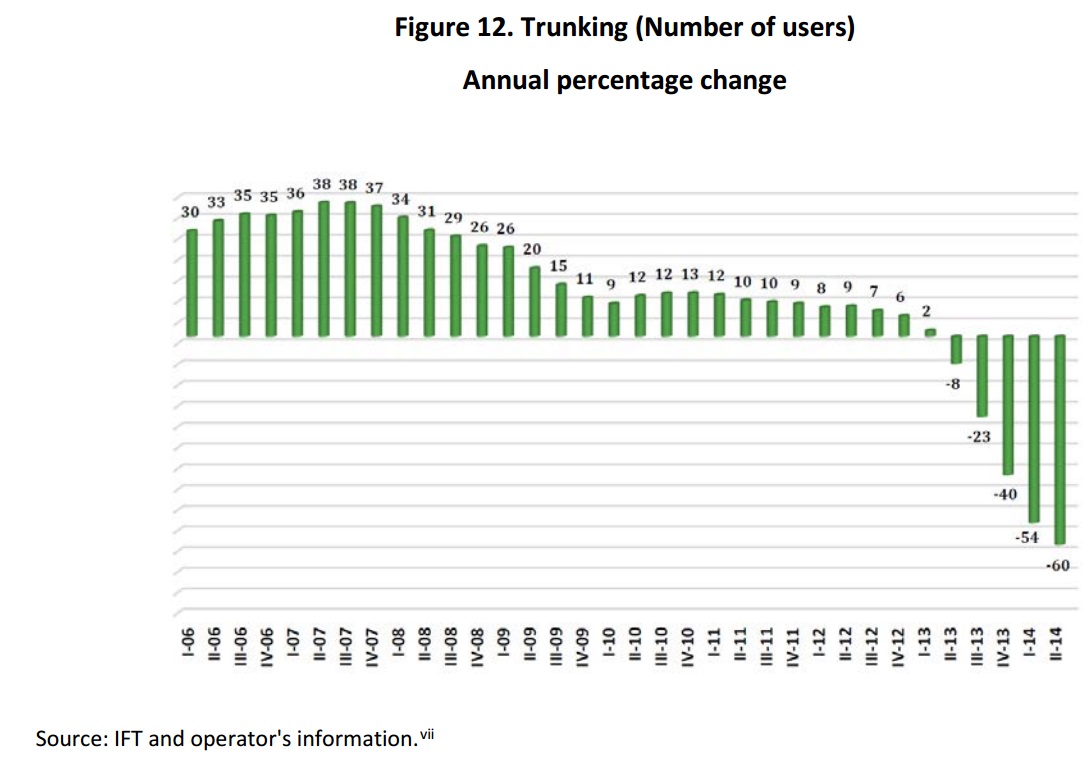
The decrease of this service is basically due to the emergence of new communication technologies resulting in a greater range of options from operators, which has led Trunking users to migrate to the last generation mobile services.
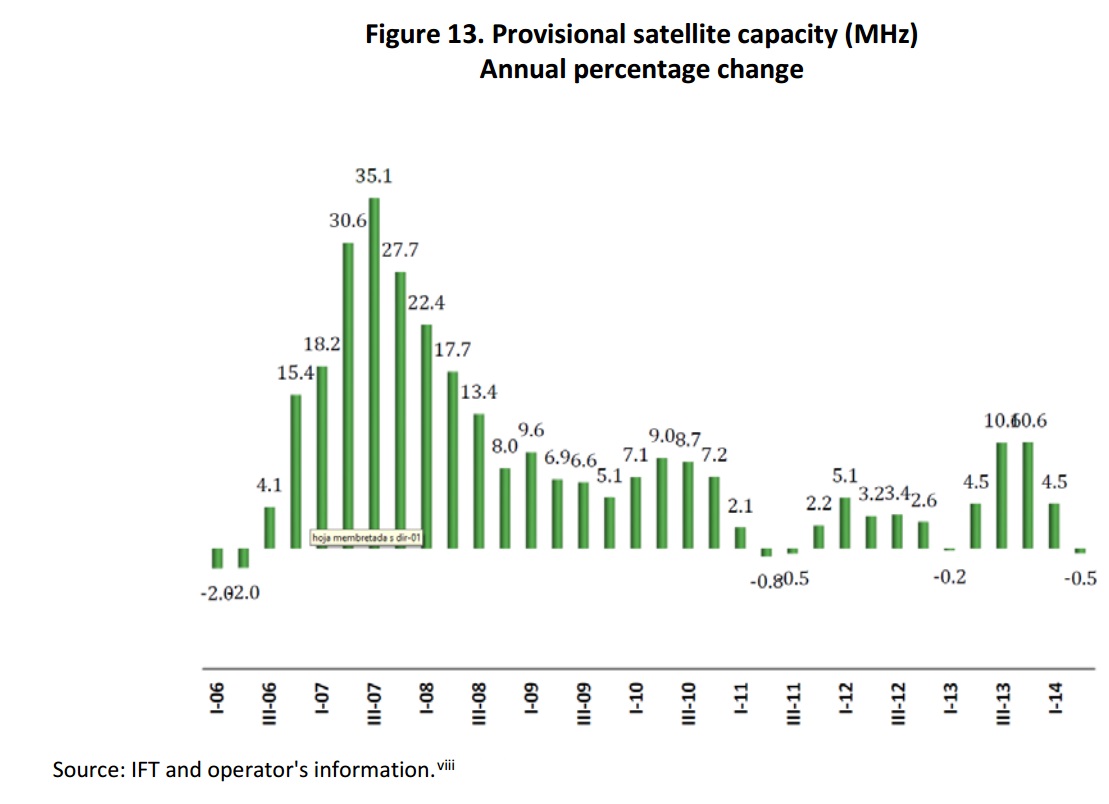
Satellite provision
In this segment is reported that the satellite provision is leased by concessionaires and includes all services as a whole. The unit of measure for the provision of satellite capacity are the Megahertz (MHz). For the second quarter of 2014, a decrease of 0.5% was recorded compared with the same quarter of 2013.
Charging evolution
The expansion of Internet services, access to technology at lower costs and competition in the telecommunications market has generated that concessionaires offer packages and promotions with increasingly attractive rates, so that they exhibit a downward trend in nominal and real terms, allowing more and more people in the country to have access to telecommunications services.
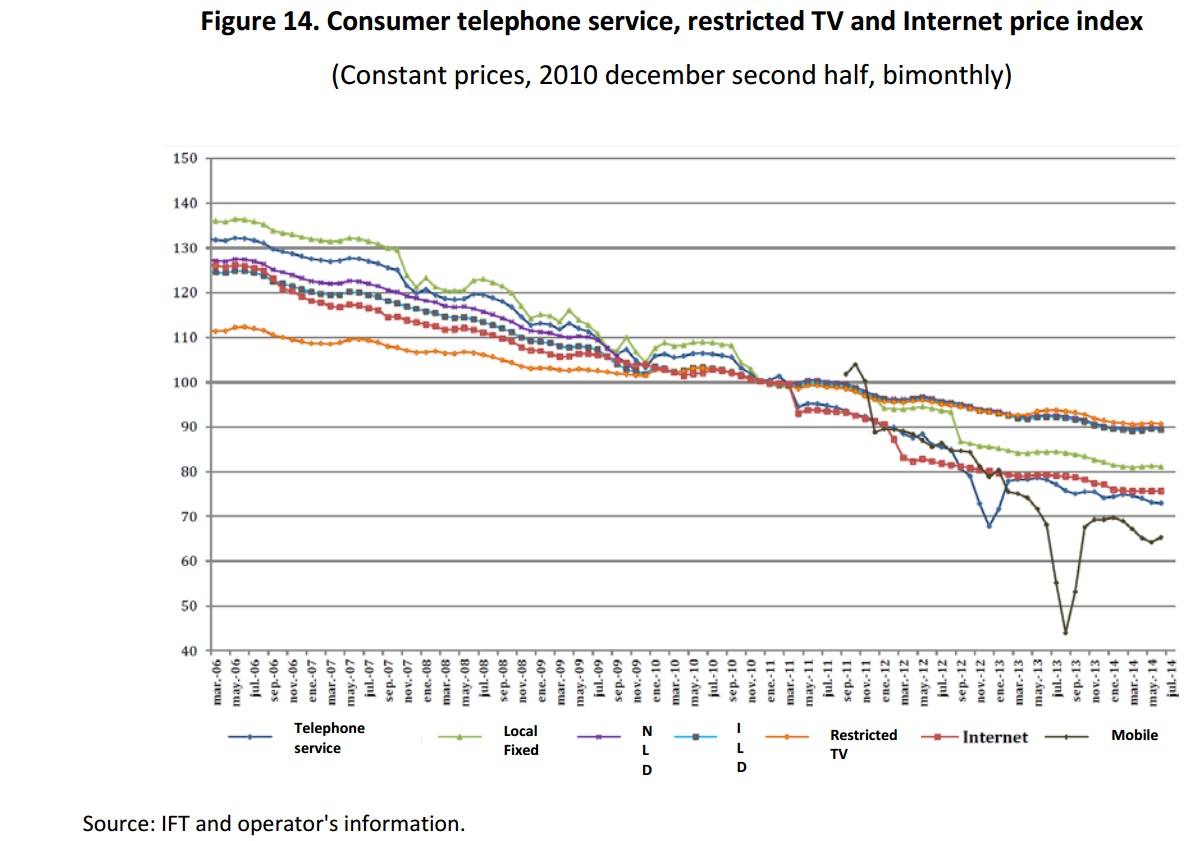
According to information from the National Institute of Statistics and Geography (Instituto Nacional de Estadística y Geografía, INEGI), prices for telecommunications services, measured based on the sub-index that make up the National Consumer Price Index (Índice Nacional de Precios al Consumidor, INPC) show significant reductions in the second quarter of 2014.
A reduction of 6.7% of Subindex Telephone Service Prices shown relative to the same period of 2013, itself consisting of a decrease of 3.9% in local service both fixed and in domestic long distance as international long distance. The largest reduction occurred in the mobile service, which was 9.1 percent.
A reduction of 6.7% on the Price Sub-index of Telephone Service is observed in relation to the same period on 2013, this is composed by a decrease of 3.9% in local fixed service and 3 % in national and international long distance and restricted television services, which was of 9.1 percent.
As a part of the Price Sub-index “Otros servicios de esparcimiento”[1] calculated by INEGI, for the second quarter, reductions on real terms are observed on a 3.2 and 4.6 per cent for restricted TV and Internet services, respectively, compared to the same period on 2013.
It is noteworthy that the measurements of prices for telecommunications services conducted by the INEGI are part of the objectives pursued by the INPC, which are measure changes over time in the general level of prices of goods and services consumed by urban households in the country. In this sense, the representativeness of their weights is focused on building a basket of goods and services that reflects the consumption house patterns.ix
i Results for the second quarter of 2014 are based on the information provided by five operators, of which one of them partially reported. Missing information was estimated according to the methodology of the Institute and using historical data.
ii Results for the second quarter of 2014 are based on the information submitted by twenty-eight operators, of which twenty of them reported information, six non-reported and two were estimated according to the methodology of the Institute and using historical data.
iii Results for the second quarter of 2014 are based on the information submitted by eighteen operators, of which seven of them reported information, six non-reporting, and five were estimated according to the methodology of the Institute and using historical data.
iv Results for the second quarter for 2014 are based on the information submitted by twenty-two operators, of which ten of them reported information and twelve did not report for the period in question.
v The results obtained for the second quarter of 2014 are based on the information submitted by twenty-two operators, of which sixteen of them reported information, five have not reported for the period in question and one was estimated according to the methodology of the Institute and using historical data.
vi The results for the second quarter of 2014 are based on the information submitted by six hundred ninety-five operators, of which two hundred and ninety of them reported information, do not report one hundred thirteen and two hundred ninety-two were estimated according to the methodology Institute and using historical data. vii Results for the second quarter for 2014 are based on information submitted by sixteen operators, of which six of them reported information, six non reported for the period in question and four were estimated according to the methodology of the Institute and using historical data.
viii Results for the second quarter for 2014 are based on information presented by eight operators, which four of them reported information two did not report for the period in question and two were estimated according to the methodology of the Institute and using historical data.
ix Further explanation can be found in the methodological INEGI documents, which can be consulted in http://www.inegi.org.mx/est/contenidos/proyectos/inp/Default.aspx.
NOTE: The results obtained in this paper emanate from data and estimates of IFT operators.
