


The IFT reports the evolution of the telecommunications services during the first quarter of 2014 (Press Release 27/2014)
The IFT reports the evolution of telecommunications services during the first quarter of 2014
- In order to consider more representative indicators, the IFT started to implement actions to define a new methodology to describe the evolution and behavior of the telecommunications sector
- In the meantime, the performance of some services will be reported quarterly
- In the period reported, restricted TV services grew 12.1%
- A total of 105 million mobile telephone subscriptions were recorded by the end of March
Due to the need of measuring the behavior of the main production variables of the national telecommunications sector, the Telecommunications Production Volume Index (Índice de Producción del Sector Telecomunicaciones, ITEL) was created in 2003. Eleven indicators were considered for its creation, which were those that best represented the sector at that time.
Therefore, ITEL measured the quarterly growth rate in terms of the traffic of minutes of mobile, national long distance, international long distance (incoming and outgoing) telephony services. By subscription, it measured the performance of fixed telephony, cable, satellite and microwave TV services, and Trunking & Paging services; as for satellite service, the indicator was the capacity used.
According to the methodology established from the beginning, the three most important variables in the composition of ITEL are the growth rates of: i) voice minutes of mobile telephony, ii) fixed local telephone lines, and iii) Trunking users. These three variables represent more than 80% of the index value. However, due to technology evolution, the performance of these three variables has been low.
As for data connectivity consumption and Internet access, have become increasingly important, so the index previously used to measure the evolution of the sector, is not applicable anymore.
Due to the changes in the preferences of the users in telecomm services and in order to consider the indicators to represent the behaviors of the sector more accurately, the IFT has started implementing the actions to define the methodology to describe the evolution and performance of the telecommunications and broadcasting sectors. This also includes processes oriented to define the variables, their time and geographical granularity, and the processes for their collection, recording, analysis and presentation. All of the above based on best international practices.
Therefore, the Institute will stop publishing the ITEL until its methodology is adjusted. Nevertheless, the IFT will continue issuing quarterly reports on the behavior of some telecomm services, such as:
Restricted TV
The restricted TV services, which are made of: cable, satellite or DTH and microwave TV, grew 12.1% during the first quarter of 2014.
The satellite or DTH TV services recorded a 10.9% growth, which in spite of being significant is lower than the growth recorded since 2009; i.e., the growth rate of these services has decreased. This modality recorded approximately a total of 8 million subscribers by the end of the first quarter of 2014.
Cable TV recorded a higher growth rate during the same quarter, 17.6% and finished the referenced quarter with a total of 7 million subscribers, representing 47% of the total users of restricted TV services.
The number of microwave TV (Microwave Multipoint Distribution Service, MMDS) subscriptions maintains its negative trend, decreasing at an annual rate of 16.4% during the first quarter in 2014, compared to the same period in 2013. By the end of this period, the service recorded more than 130 thousand subscribers.

Mobile Telephony
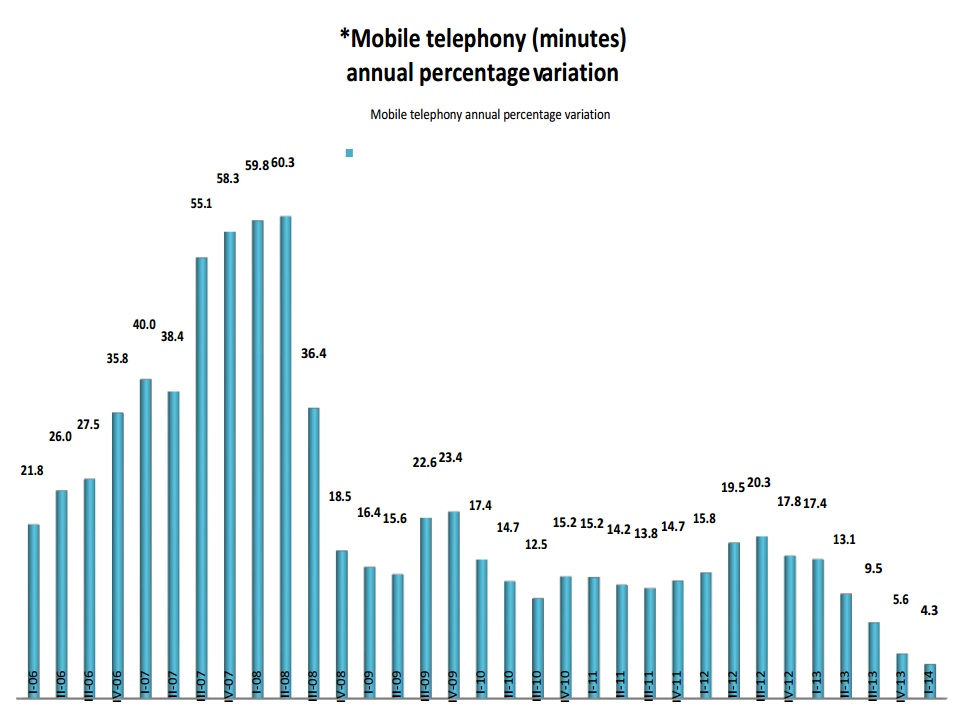
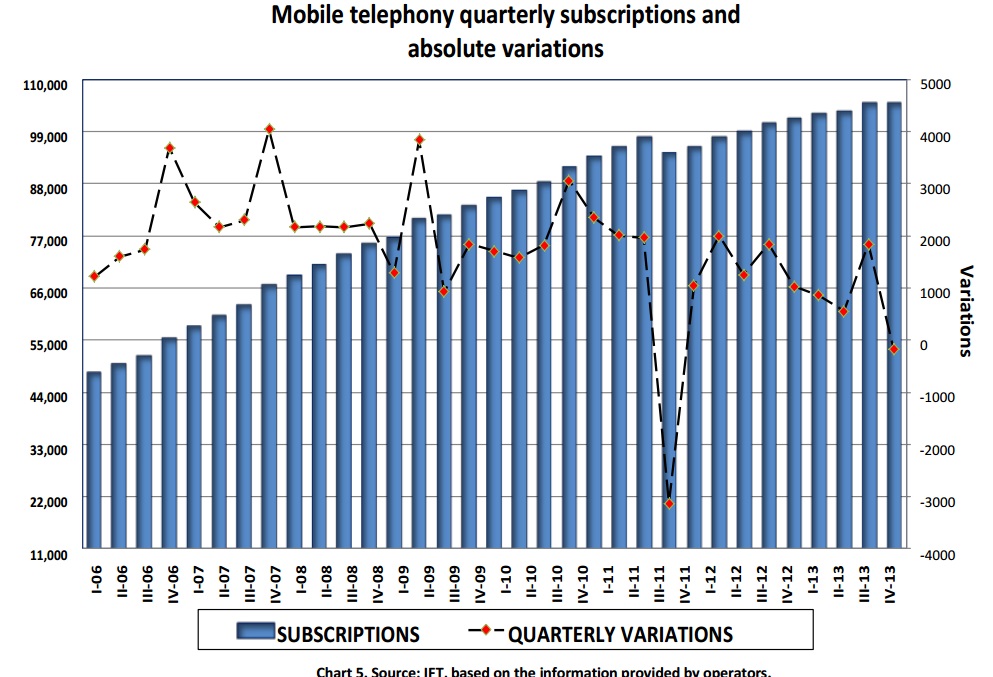
Mobile telephony recorded a 4.3% increase in traffic minutes run by the network during the first quarter of 2014. Three million subscribers were added during the quarter, compared to the same period the previous year, representing a 3.03% increase. The total subscription base is 105 million.
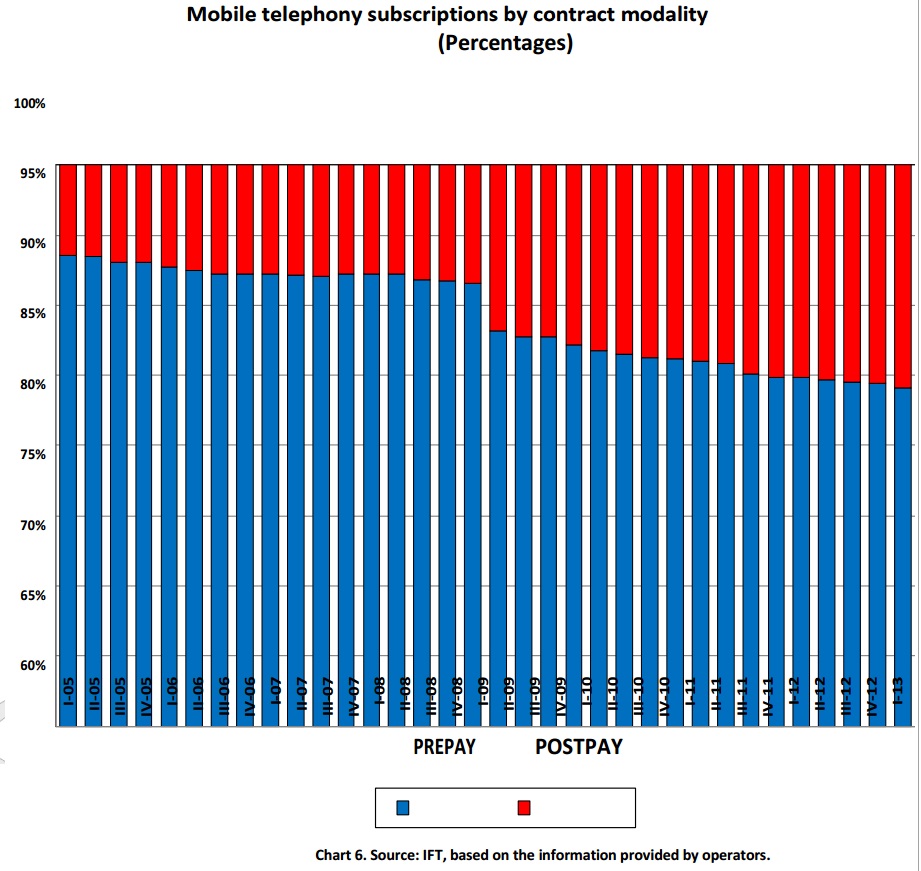
Regarding the market composition by type of subscription, by the end of the first quarter in 2014 there were 16 million post-pay users, representing 15.2% of the total market. While prepay modality recorded 88.8 million subscriptions, a 3.4% growth compared to the same period in 2013, and 84.7% of the total market.
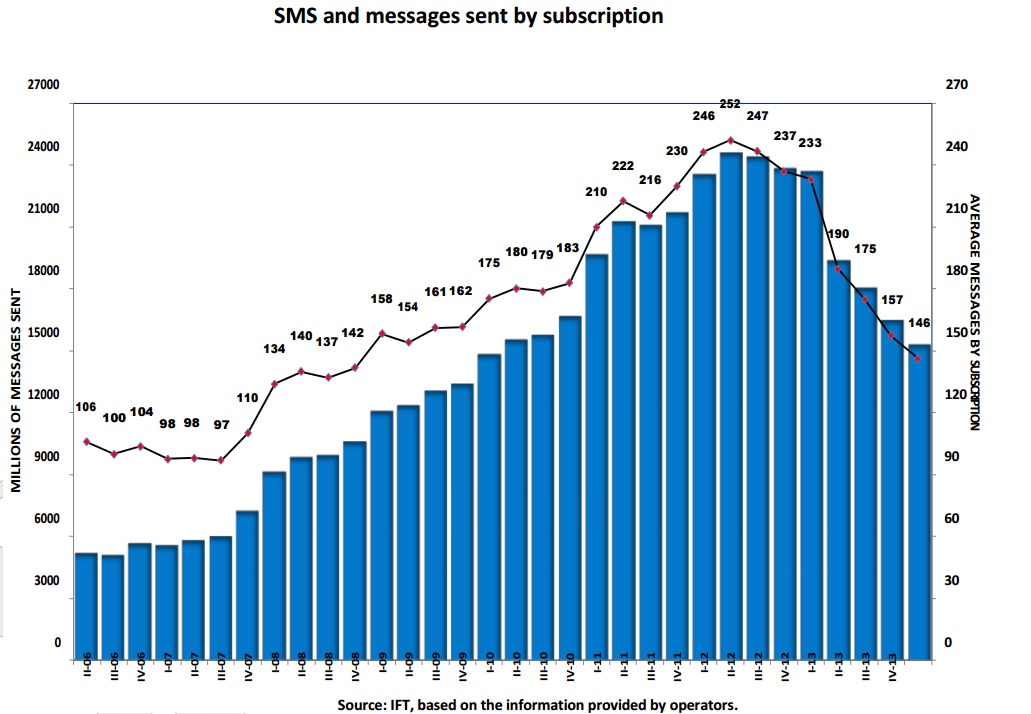
Messages sent (SMS) through mobile telephony recorded a 35.3% decease, compared to the first quarter in 2013, which equals an average of 144 messages sent by subscription during that period, the lowest figure recorded since the second quarter of 2009, reaching a maximum historical record of 252 SMS during the same period in 2012. This downward trend could be due to the migration of users to data-connectivity communication services (for example: Whatsapp, Skype, Messenger, Line, and Telegram, among others).
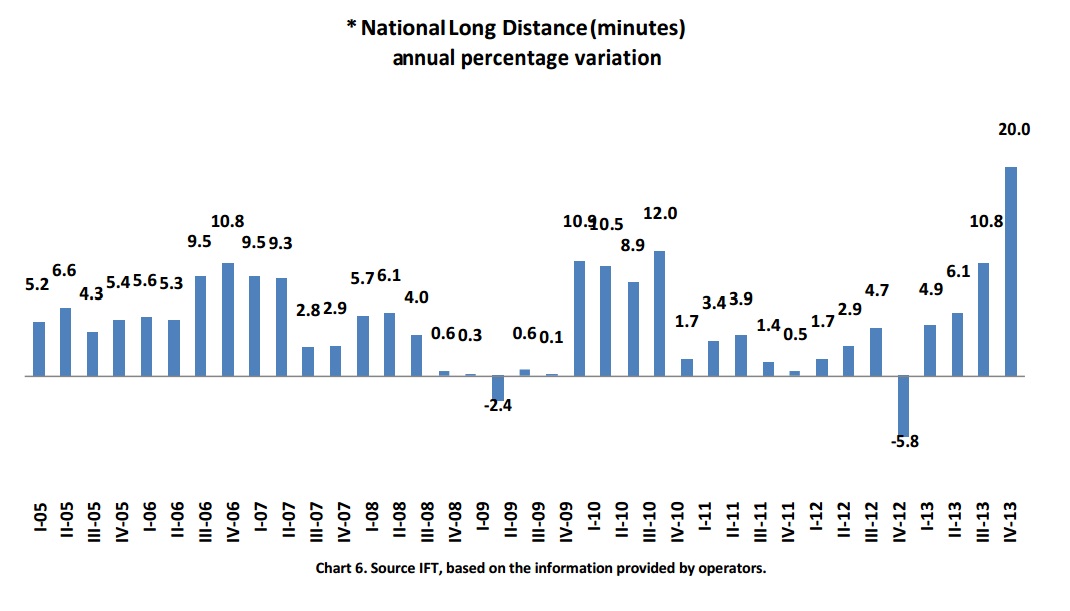
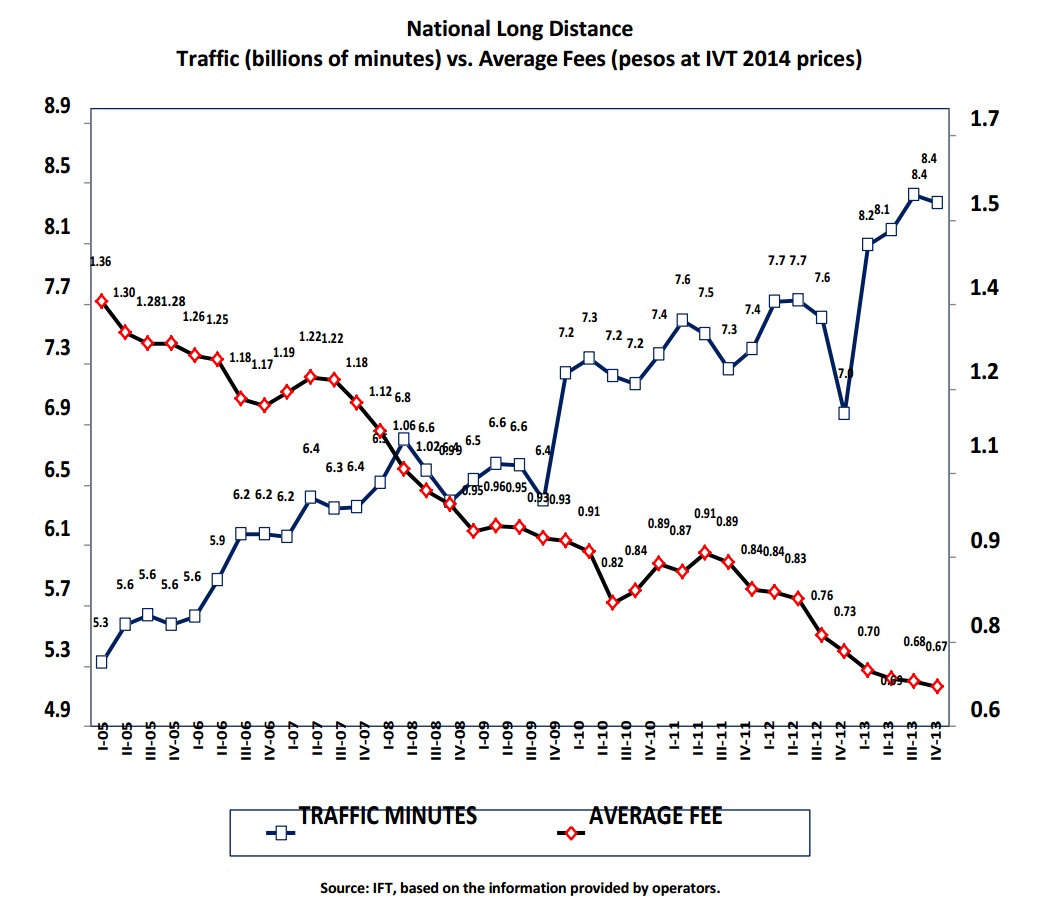
National Long Distance
During the quarter reported, the traffic measured in minutes grew 20% compared to the same quarter the previous year.
The national long distance average fee recorded was 0.67 pesos per minute.
International Long Distance
In the referenced quarter, the incoming international long distance traffic minutes increased 4% compared to the third quarter in 2013.
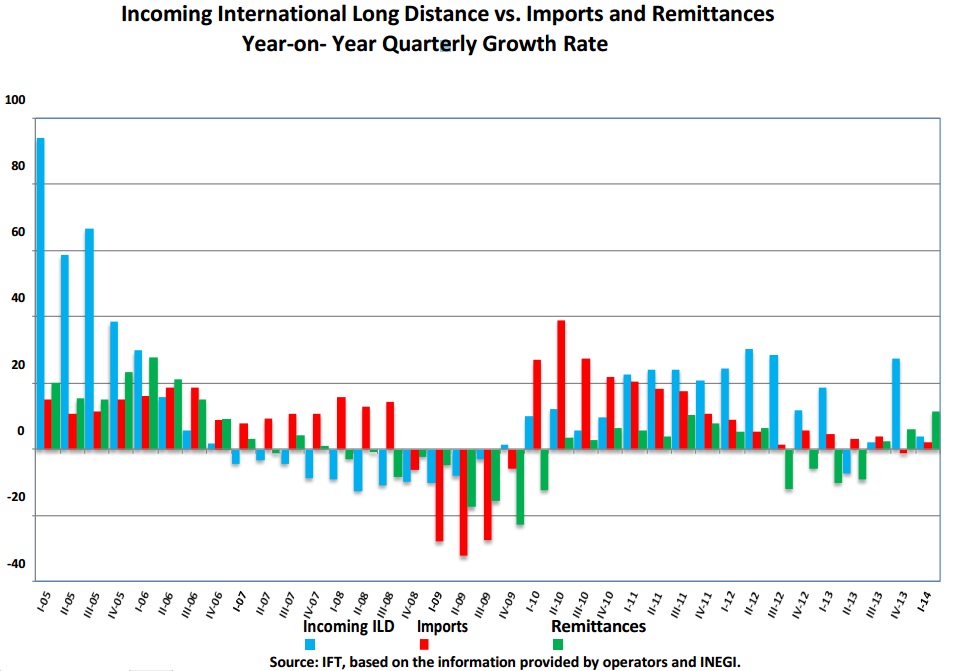
The outgoing international long distance traffic minutes recorded a 15% growth during the quarter reported, compared to the same period the previous year.

Trunking
During the last quarter of 2014, the number of users in this segment decreased 53.8% compared to the same period in 2013, which was the lowest rate reported since its behavior started to be measured.
The users of trunking services are migrating to the latest mobile technology services, recording 1.78 million users by the end of the first quarter in 2014.

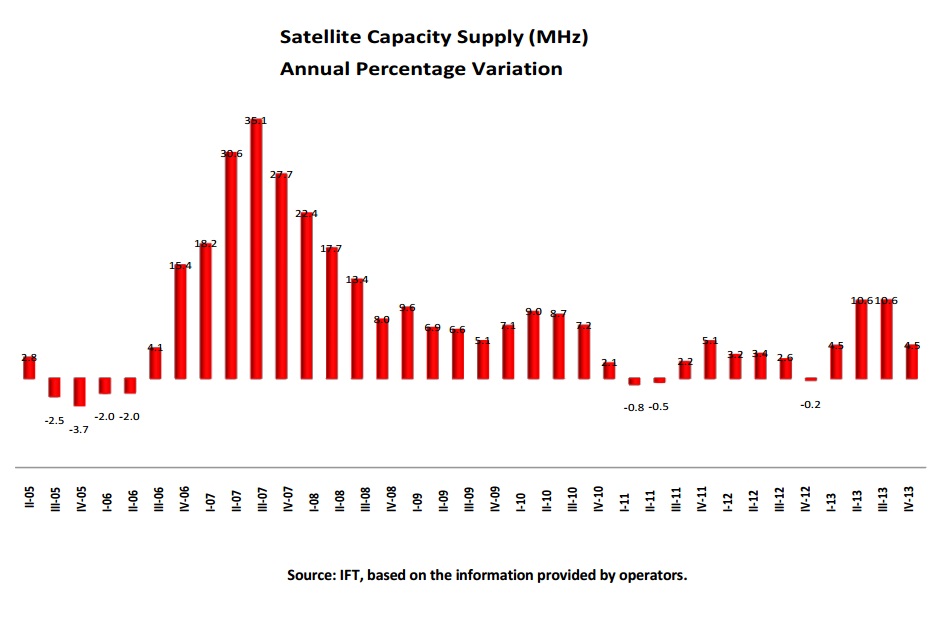
Satellite Supply
This segment recorded an annual increase of 4.5% during the first quarter in 2014. Megahertz (MHz) is the unit used to measure satellite capacity supply.
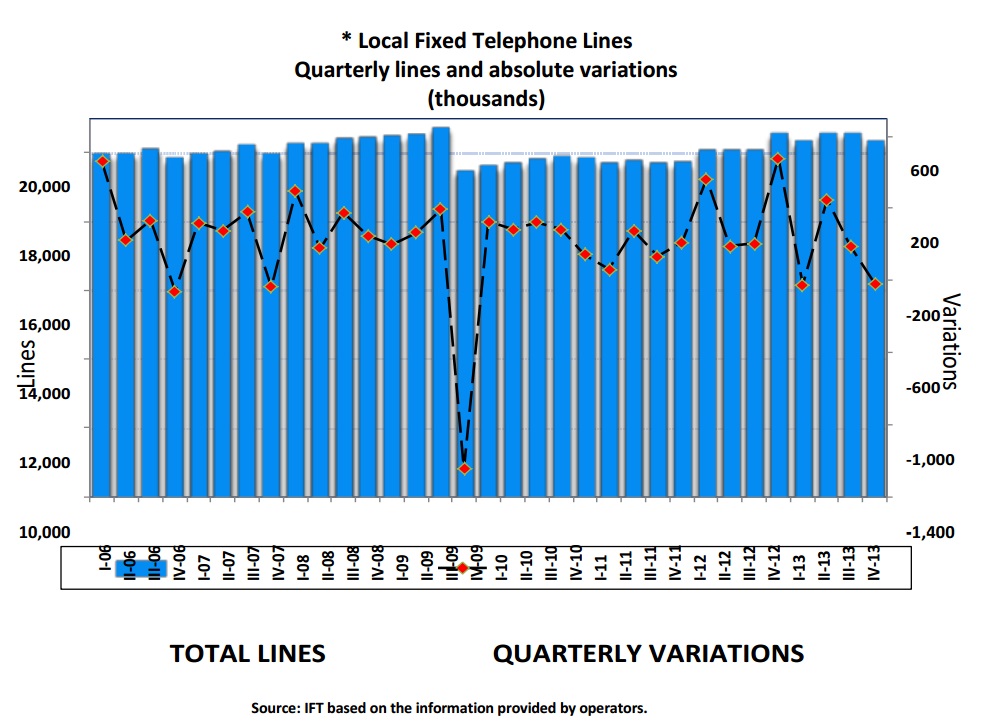
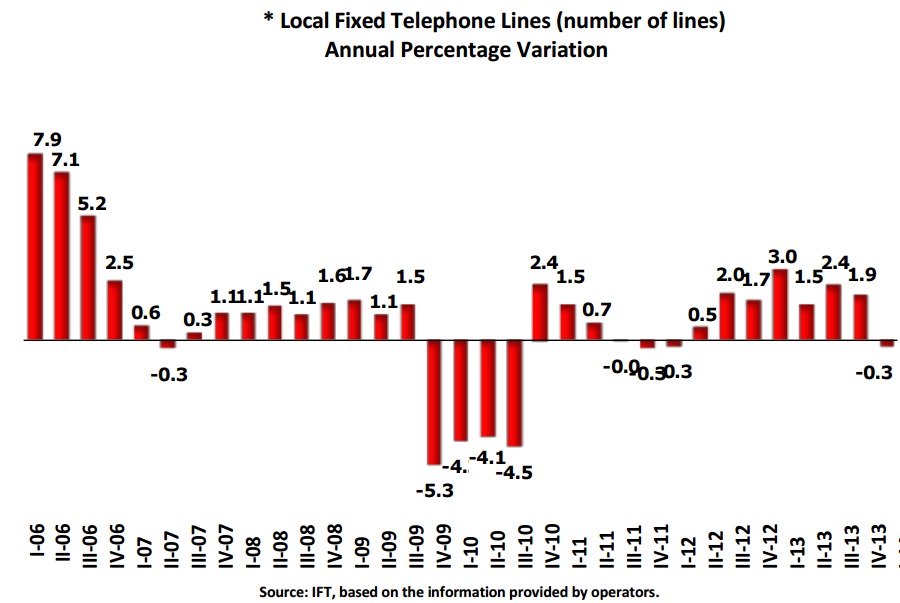
Local Telephone Fixed Line
By the end of 2014 first quarter, the total number of fixed telephone line subscriptions was 20.4 million, which represented 200 thousand lines more than those recorded during the same quarter in 2013.
Fees Evolution
The expansion of Internet services, lower Internet access fees and competition in telecomm markets forced concessionaires to offer packages and promotions with increasingly attractive fees; therefore, fees tend to decrease in nominal and real terms, allowing an increasing number of inhabitants to have access to these services.

According to the information provided by the National Institute of Statistics and Geography (Instituto Nacional de Estadística y Geografía, INEGI), telecomm services costs, according to the sub-indexes of the National Index of Consumer Prices (INPC), showed a significant decrease during the first quarter in 2014.
During the quarter reported, the Sub-Index of telephone services fees decreased 4.6%, compared to the same period in 2013, including a 3.8% decrease of local fixed services, 3.0% reductions in national long distance and international long distance services, and a 5.4% decrease in mobile telephony services.
As part of the Sub-Index of other recreational services estimated by INEGI, there are actual reductions of 2.2% and 4.3% in pay TV and Internet services, respectively, compared to the same period in 2013.
It is important to highlight that the measurement of telecomm services fees made by INEGI is part of INPC's objectives, which include measuring the evolution, in time, of the general-cost of goods and services consumed in urban households in the country. In this sense, the representativeness of their considerations focuses on creating a set of goods and services to properly reflect household consumer patterns.[1]
[1] A broader explanation can be found in the methodological documents of INEGI at: http://www.inegi.org.mx/est/contenidos/proyectos/inp/Default.aspx.
